
Machine Learning Metrics tips and tricks cheatsheet

Classification metrics
In a context of a binary classification, here are the main metrics that are important to track in order to assess the performance of the model.
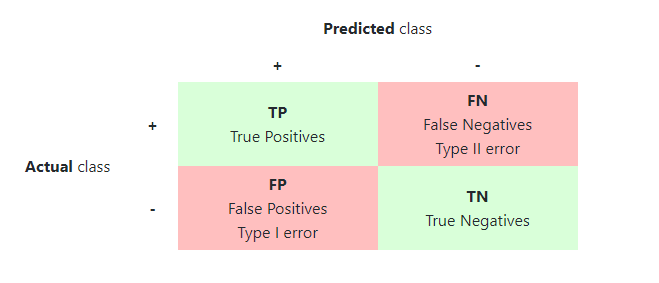
- Confusion matrix : The confusion matrix is used to have a more complete picture when assessing the performance of a model. It is defined as follows:
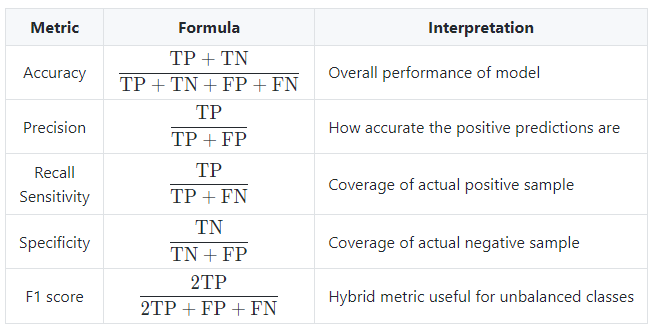
- Main metrics : The following metrics are commonly used to assess the performance of classification models:
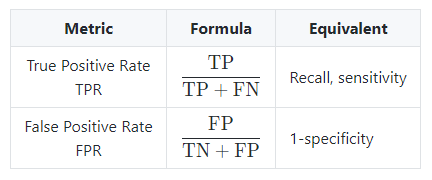
- ROC : The receiver operating curve, also noted ROC, is the plot of TPR versus FPR by varying the threshold. These metrics are summed up in the table below:
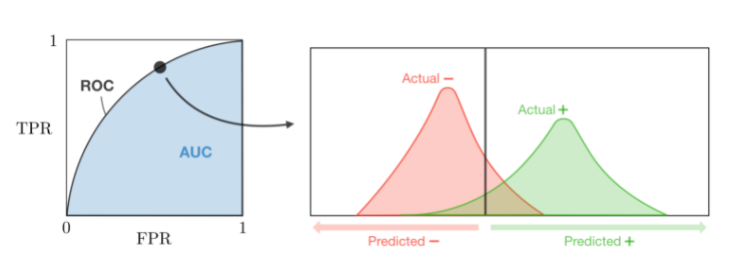
- AUC : The area under the receiving operating curve, also noted AUC or AUROC, is the area below the ROC as shown in the following figure:
Regression metrics
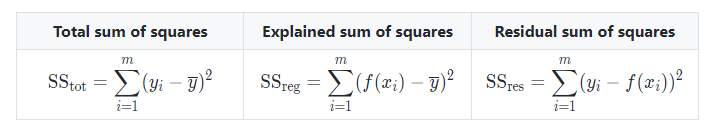
- Basic metrics : Given a regression model ff, the following metrics are commonly used to assess the performance of the model:
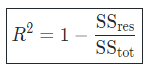
- Coefficient of determination : The coefficient of determination, often noted R^2 or R2, provides a measure of how well the observed outcomes are replicated by the model and is defined as follows:
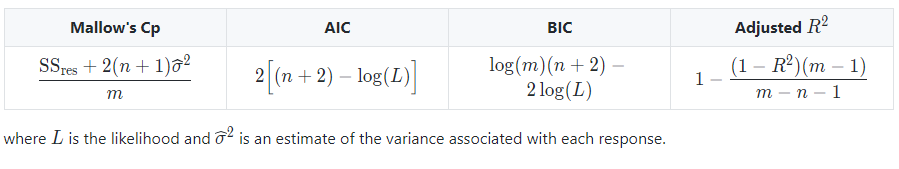
- Main metrics : The following metrics are commonly used to assess the performance of regression models, by taking into account the number of variables nn that they take into consideration:
Model selection
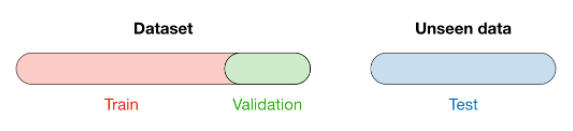
- Vocabulary : When selecting a model, we distinguish 3 different parts of the data that we have as follows:
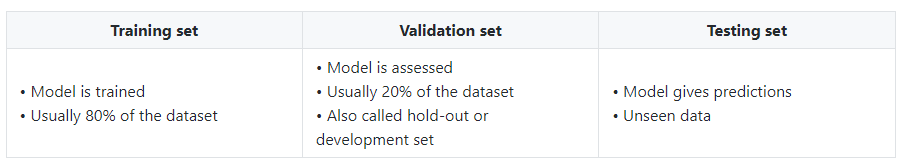
Once the model has been chosen, it is trained on the entire dataset and tested on the unseen test set. These are represented in the figure below:
- Cross-validation : Cross-validation, also noted CV, is a method that is used to select a model that does not rely too much on the initial training set. The different types are summed up in the table below:
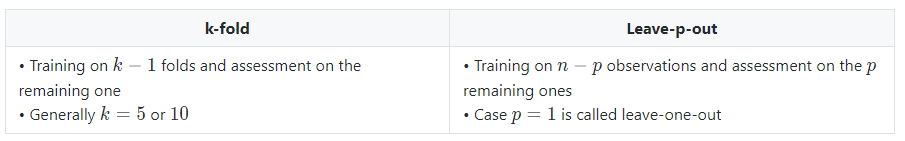
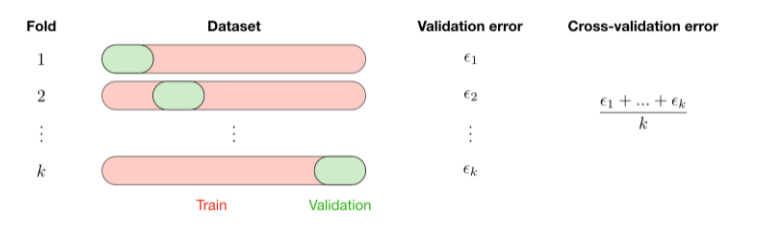
The most commonly used method is called k-fold cross-validation and splits the training data into k folds to validate the model on one fold while training the model on the k-1 other folds, all of this k times. The error is then averaged over the k folds and is named cross-validation error.
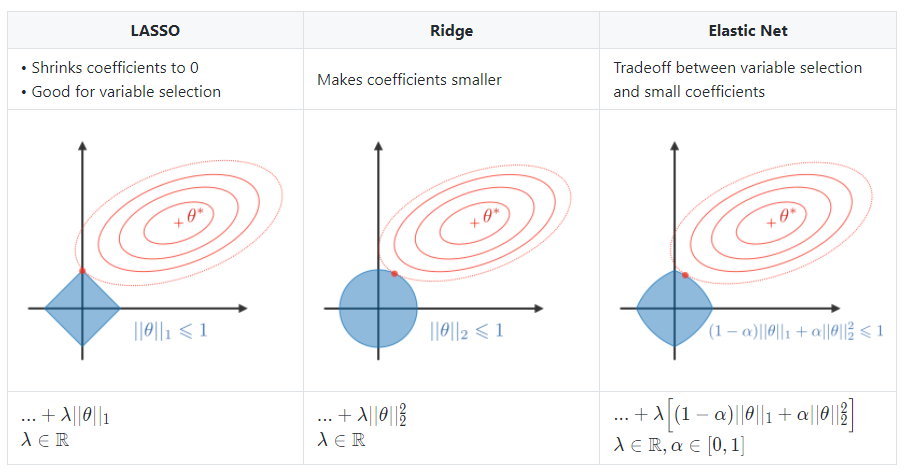
- Regularization : The regularization procedure aims at avoiding the model to overfit the data and thus deals with high variance issues. The following table sums up the different types of commonly used regularization techniques:
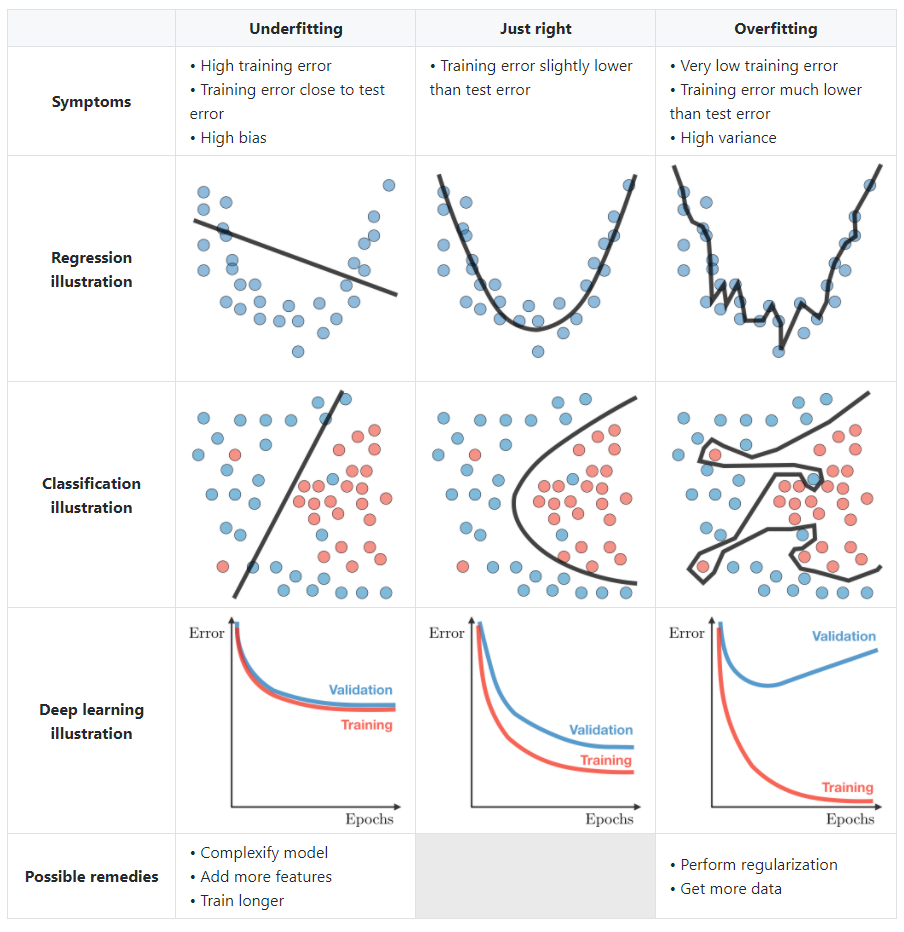
Diagnostics
- Bias : The bias of a model is the difference between the expected prediction and the correct model that we try to predict for given data points.
Variance : The variance of a model is the variability of the model prediction for given data points.
Bias/variance tradeoff : The simpler the model, the higher the bias, and the more complex the model, the higher the variance.
- Error analysis : Error analysis is analyzing the root cause of the difference in performance between the current and the perfect models.
-Ablative analysis : Ablative analysis is analyzing the root cause of the difference in performance between the current and the baseline models.


