Linear Regression

Linear Regression
Linear regression attempts to model the relationship between two variables by fitting a linear equation to observed data. One variable is said to be independent and the other one is said to be dependent.
y=mx + c
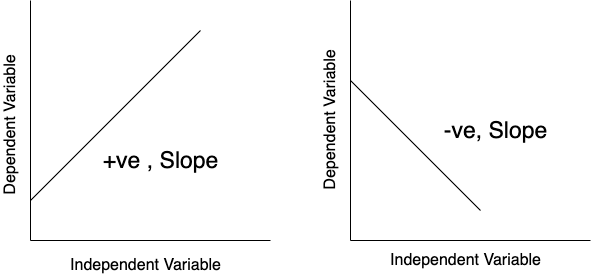
The core concept is to model using a straight line
Linear Regression is usually used for Continuous Variable or Value, or in a simple term to predict some quantity
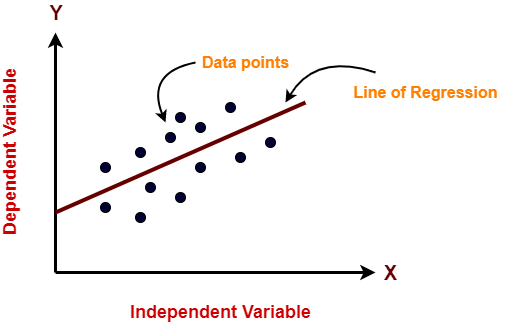
The dependent variable is plotted on Y-axis and the Independent variable on X-axis.
Now, Lets us Understand Linear Regression with an Example
Let us consider some points for an Independent Variable
X = { 1 , 2 , 3 , 4 , 5 }
Y = { 3 , 4, 2 , 4 , 5 }
or
(1,3) , (2,4) , (3,2) , (4,4) , (5,5)
Now to find the slope we need to first get x - x_mean and y - y_mean
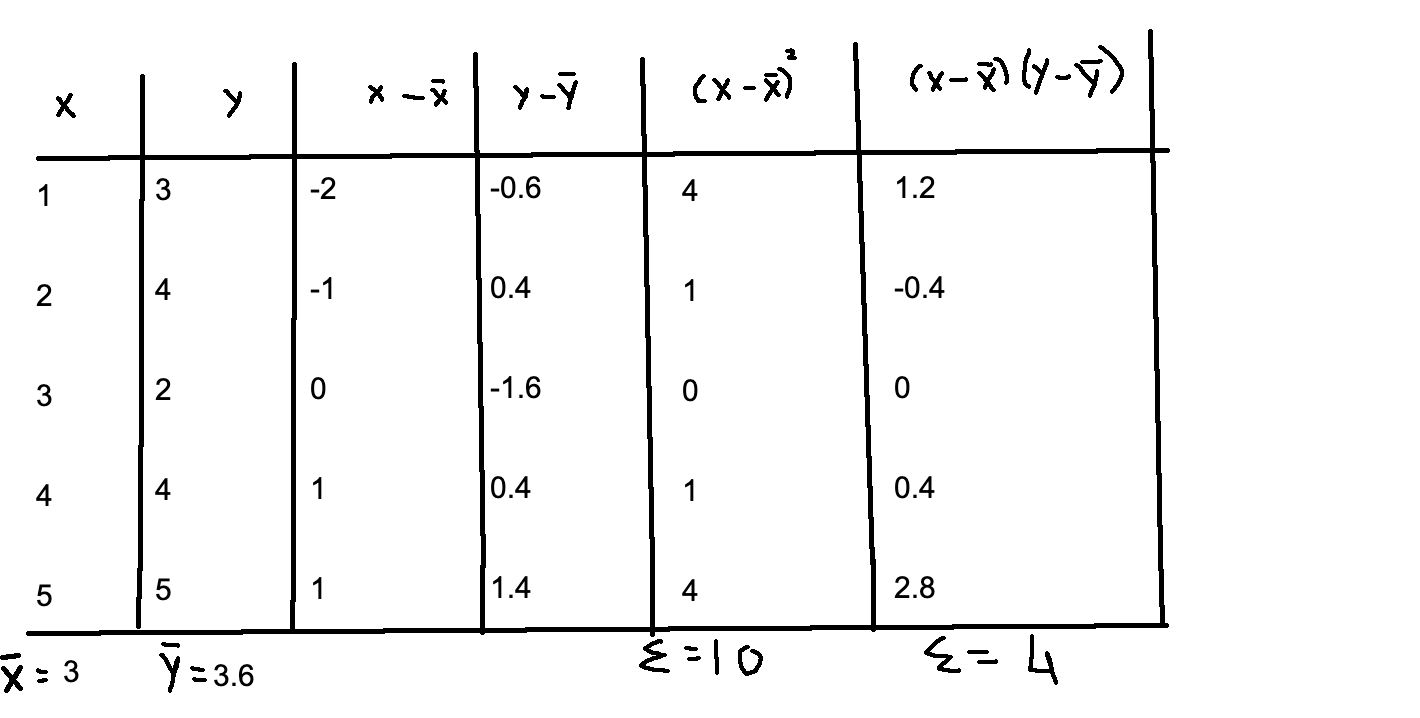
Now to calculate the slope we use the formula
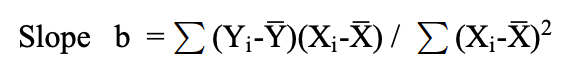
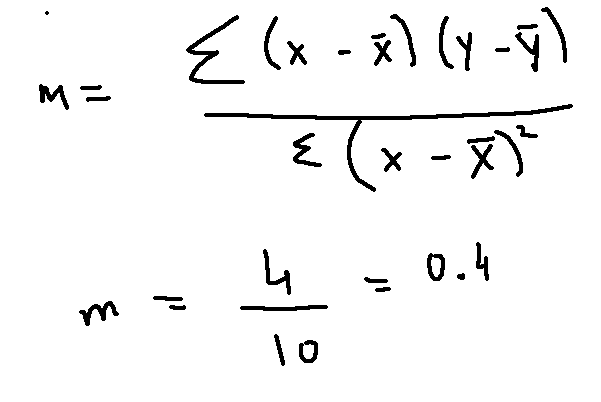
Now solving the above equation with the values fetched from the table we get the slope (m) value
Now we can use the slope value and x mean and y mean value and find the constant from the equation, y = mx + c
Equation, y = mx + c
where y = y mean value , x = x mean value, m = slope calculated above
We substitute all the values to get c
m = 0.4
x = 3
y = 3.6
y = mx + c
3.6 = 0.4*3 + c
c = 2.4
Now that we have all the values, the final equation will be
y = m.x + c

y = 0.4.x + 2.4         -----> final equation
Finally, substituting all x values in the final equation we get yhat
Now we can plot a straight line with (x,yhat) this line is known as the regression line
For Single Linear Regression
y = m.x +c
For Multiple Linear Regression
y = m1.x1 + m2.x2 + m3.x3 + ..... + mi.xi + c
Linear Regression Evaluation Metrics
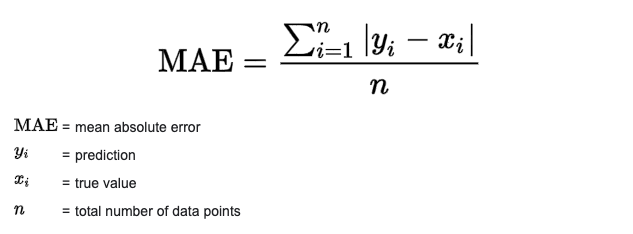
- Mean Absolute Error (MAE):- MAE is the mean of absolute error value i.e. it is the mean of the difference between the actual value and predicted value
Example
| Actual Value | Predicted Value | Error |
| 100 | 130 | -30 |
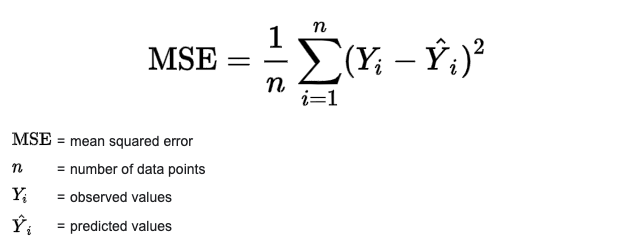
- Mean Squared Error (MSE):- MSE is the measures the average of the squares of the errors
MSE is always positive and a value closer to 0 or lower is better
A model with lower MSE will be deemed better
Example
| Actual Value | Predicted Value | Error | Square |
| 100 | 130 | -30 | 900 |
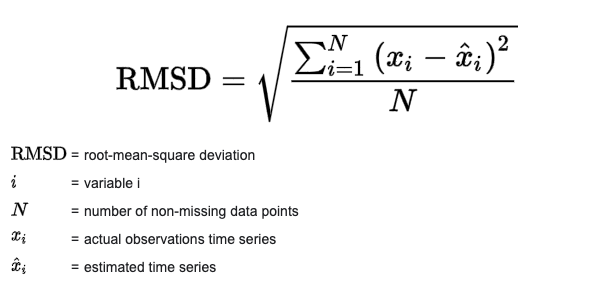
- Root Mean Squared Error (RMSE):- RMSE is the Standard Deviation of the Error and root of MSE
RMSE indicates the spread of the residual error. It is always positive and a lower value indicated better performance
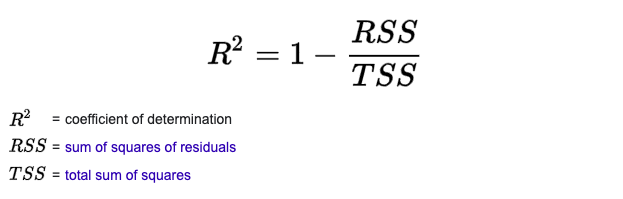
- R Square:- R squared value is a statistical measure of how close the data are fitted regression line
It is also known as the coefficient of Determination, or the coefficient of multiple determination